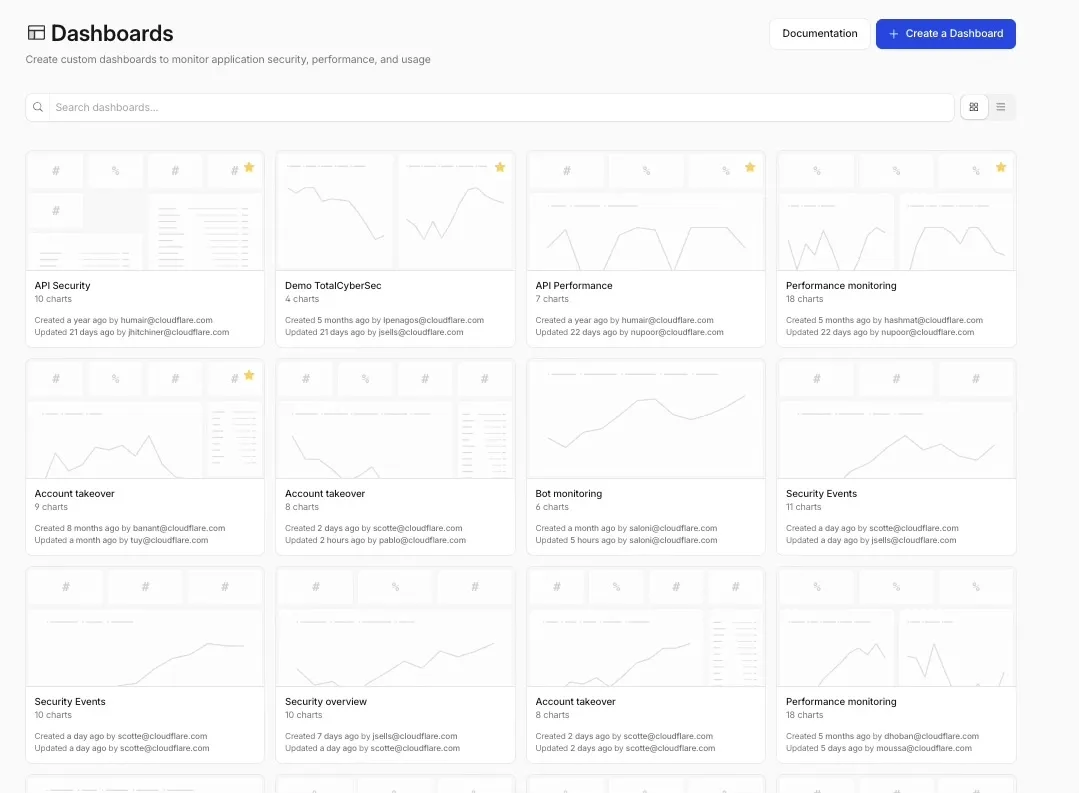
Custom Dashboards are now available to all Cloudflare customers. Build personalized views that highlight the metrics most critical to your infrastructure and security posture, moving beyond standard product dashboards.
This update significantly expands the data available for visualization. Build charts based on any of the 100+ datasets available via the Cloudflare GraphQL API, covering everything from WAF events and Workers metrics to Load Balancing and Zero Trust logs.
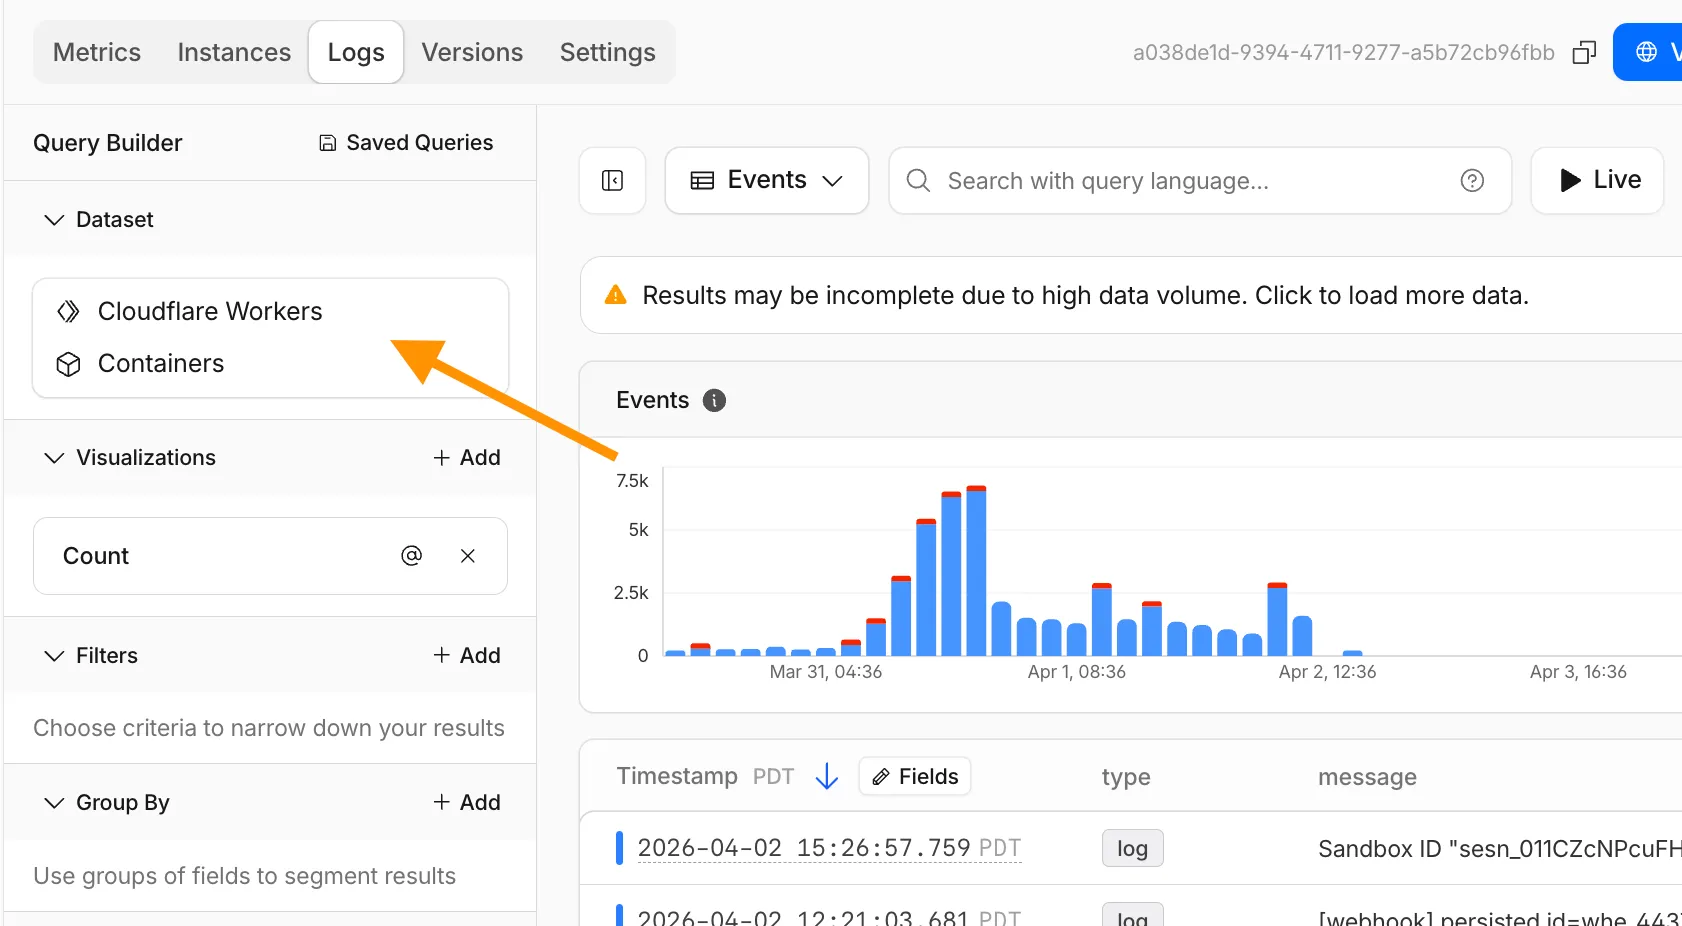
Log Explorer integration
For Log Explorer customers, you can now turn raw log queries directly into dashboard charts. When you identify a specific pattern or spike while investigating logs, save that query as a visualization to monitor those signals in real-time without leaving the dashboard.
Key benefits
- Unified visibility: Consolidate signals from different Cloudflare products (for example, HTTP Traffic and R2 Storage) into a single view.
- Flexible monitoring: Create charts that focus on specific status codes, ASN regions, or security actions that matter to your business.
- Expanded limits: Log Explorer customers can create up to 100 dashboards (up from 25 for standard customers).
To get started, refer to the Custom Dashboards documentation.