In the Cloudflare One dashboard, the overview page for a specific Cloudflare Tunnel now shows all replicas of that tunnel and supports streaming logs from multiple replicas at once.
Previously, you could only stream logs from one replica at a time. With this update:
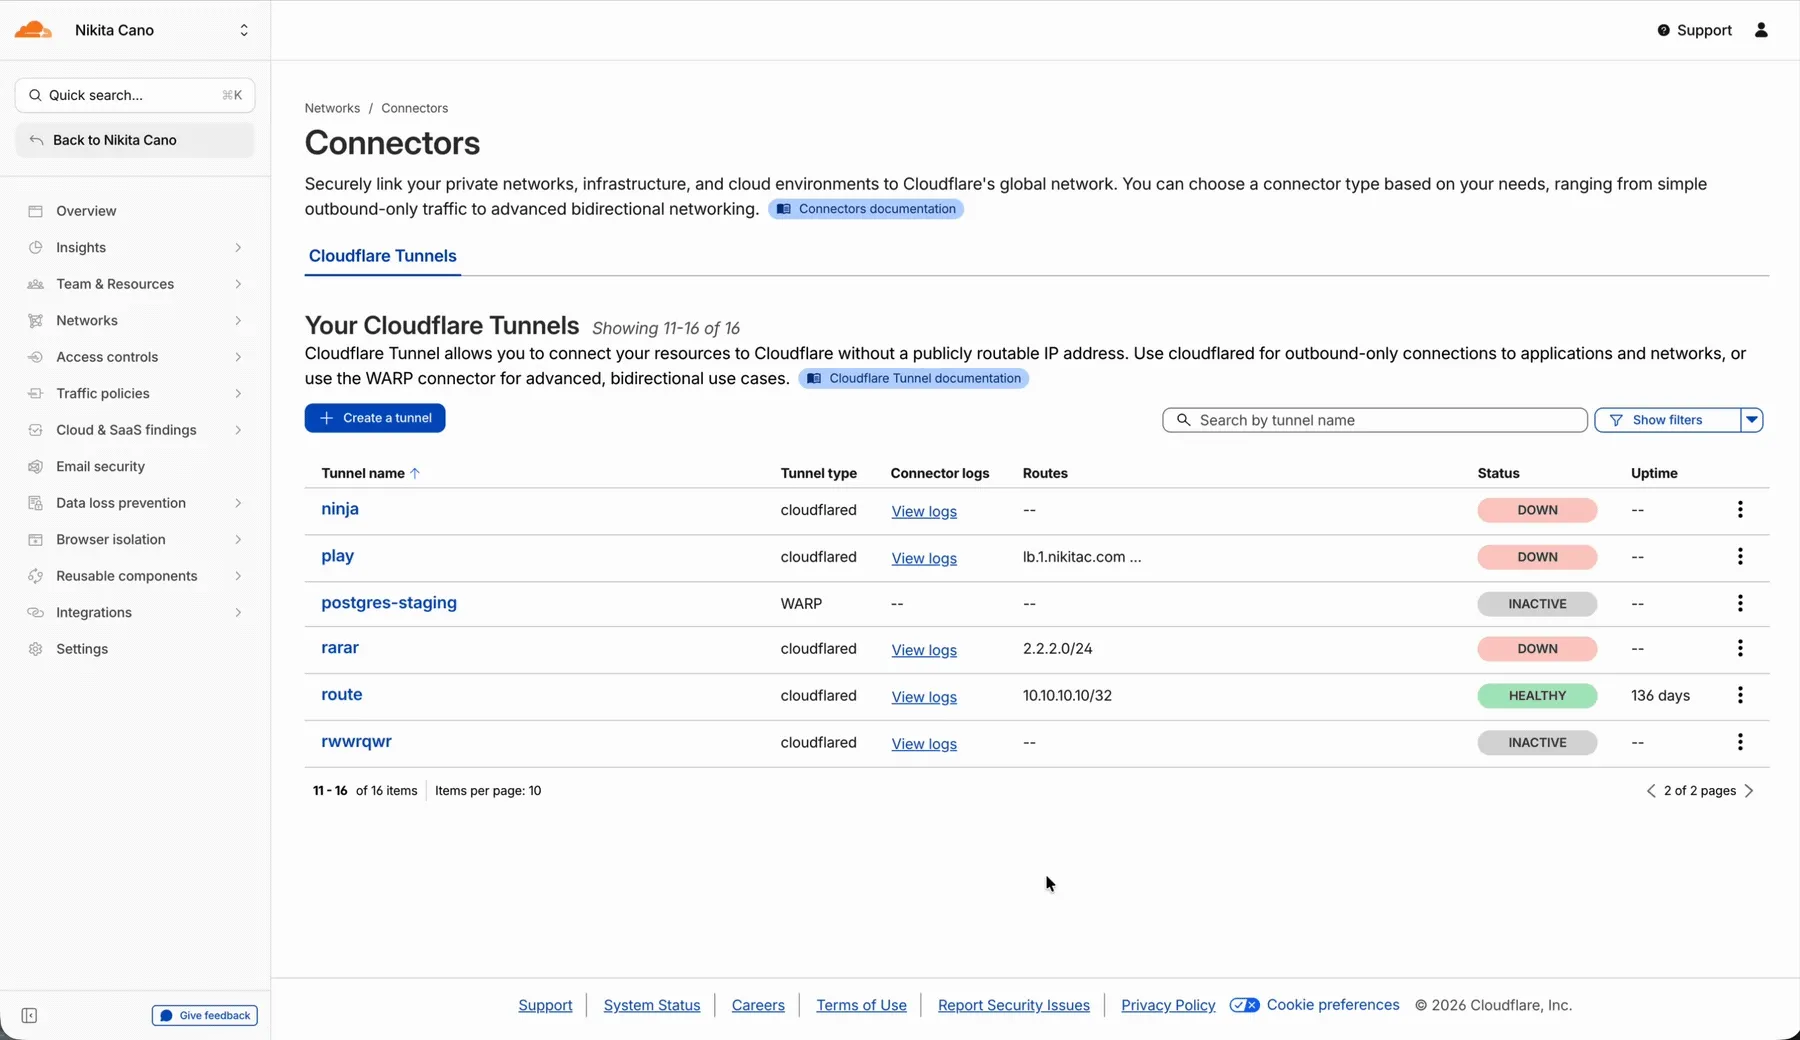
- Replicas on the tunnel overview — All active replicas for the selected tunnel now appear on that tunnel’s overview page under Connectors. Select any replica to stream its logs.
- Multi-connector log streaming — Stream logs from multiple replicas simultaneously, making it easier to correlate events across your infrastructure during debugging or incident response. To try it out, log in to Cloudflare One and go to Networks > Connectors > Cloudflare Tunnels. Select View logs next to the tunnel you want to monitor.
For more information, refer to Tunnel log streams and Deploy replicas.